What to know about Zeni’s SaaS LTV calculator
Customer lifetime value (LTV) is the net profit you expect your company to generate from a given customer over the course of your relationship. It reflects the total revenue they’ll produce minus the costs to acquire and retain their business.
LTV is a key measure of your unit economics, which refers to how efficiently your operation generates profits on a per-unit basis. Strength in this area is often crucial for achieving sustainable growth over the long term.
As a result, unit economics are especially emphasized for software-as-a-service (SaaS) startups, which are typically built around recurring revenue and seek to scale aggressively over time.
Zeni’s SaaS lifetime value calculator helps you analyze LTV alongside other key performance indicators (KPIs) related to unit economics, including your customer acquisition cost (CAC) payback period, LTV:CAC ratio, and average customer lifespan.
In addition to guiding internal decisions regarding growth strategy, these metrics play a central role in fundraising. Venture capital (VC) investors rely on them heavily to assess your company’s potential, so you must be ready to provide and discuss them.
How to use Zeni’s SaaS LTV calculator
Step 1: Enter your average revenue per account
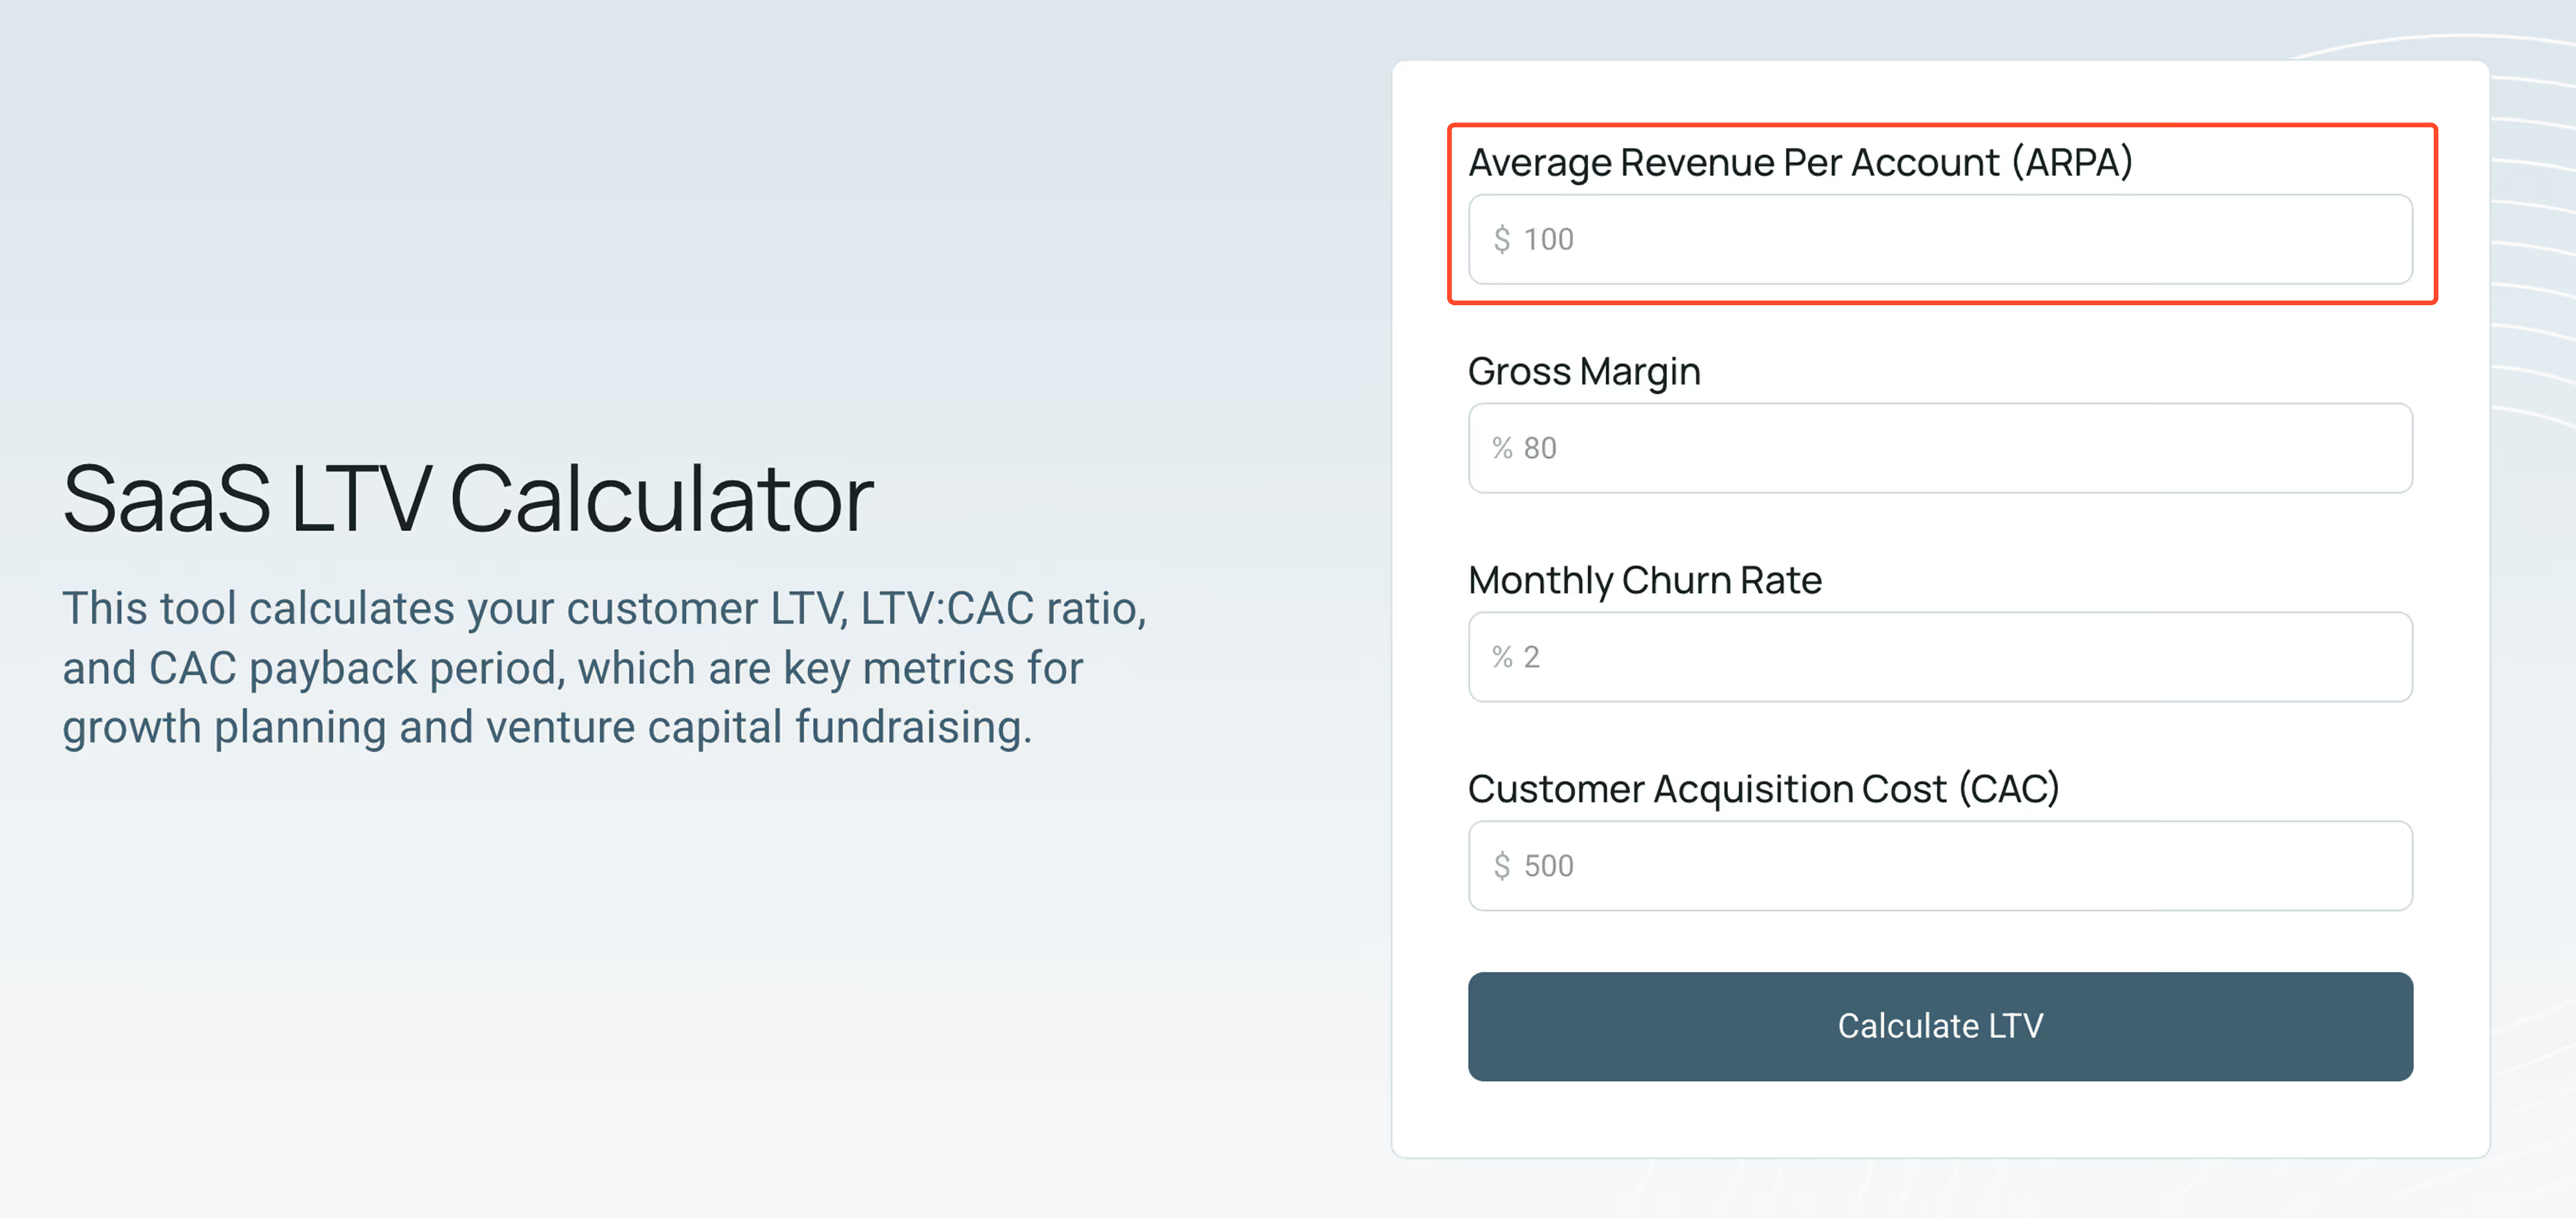
Start by entering your average revenue per account (ARPA). This is equal to your monthly recurring revenue (MRR) on a per-customer basis, or how much the average customer pays you each month.
To calculate this amount, divide your total MRR by your number of active accounts. For example, if your SaaS company currently generates $50,000 in MRR across 500 contracted accounts, your ARPA is $100.
Importantly, because ARPA is an average, large variations in customer spending can distort results. For example, if a few high-paying accounts make up a disproportionate share of your MRR, your ARPA may overstate the value of a typical customer.
Since ARPA is a core component of the numerator in the LTV calculation, this can also cause you to overstate your LTV. In these cases, it may be helpful to sort accounts into appropriate segments and analyze them separately.
Step 2: Input your gross profit margin

Next, input your gross profit margin as a percentage in the “Gross margin” field. This reflects the portion of your revenue that remains after deducting your cost of sales, which contains all expenses directly related to providing your product or service.
For SaaS companies, these expenses often include the cost of hosting infrastructure as well as the wages paid to employees in charge of supporting existing customers and keeping your software systems up and running.
Factoring gross margin into your LTV calculation ensures the metric shows how much each customer generates in gross profit rather than revenue. Generally, having a higher gross margin increases each customer’s LTV, while a lower margin reduces it.
Step 3: Add your monthly churn rate
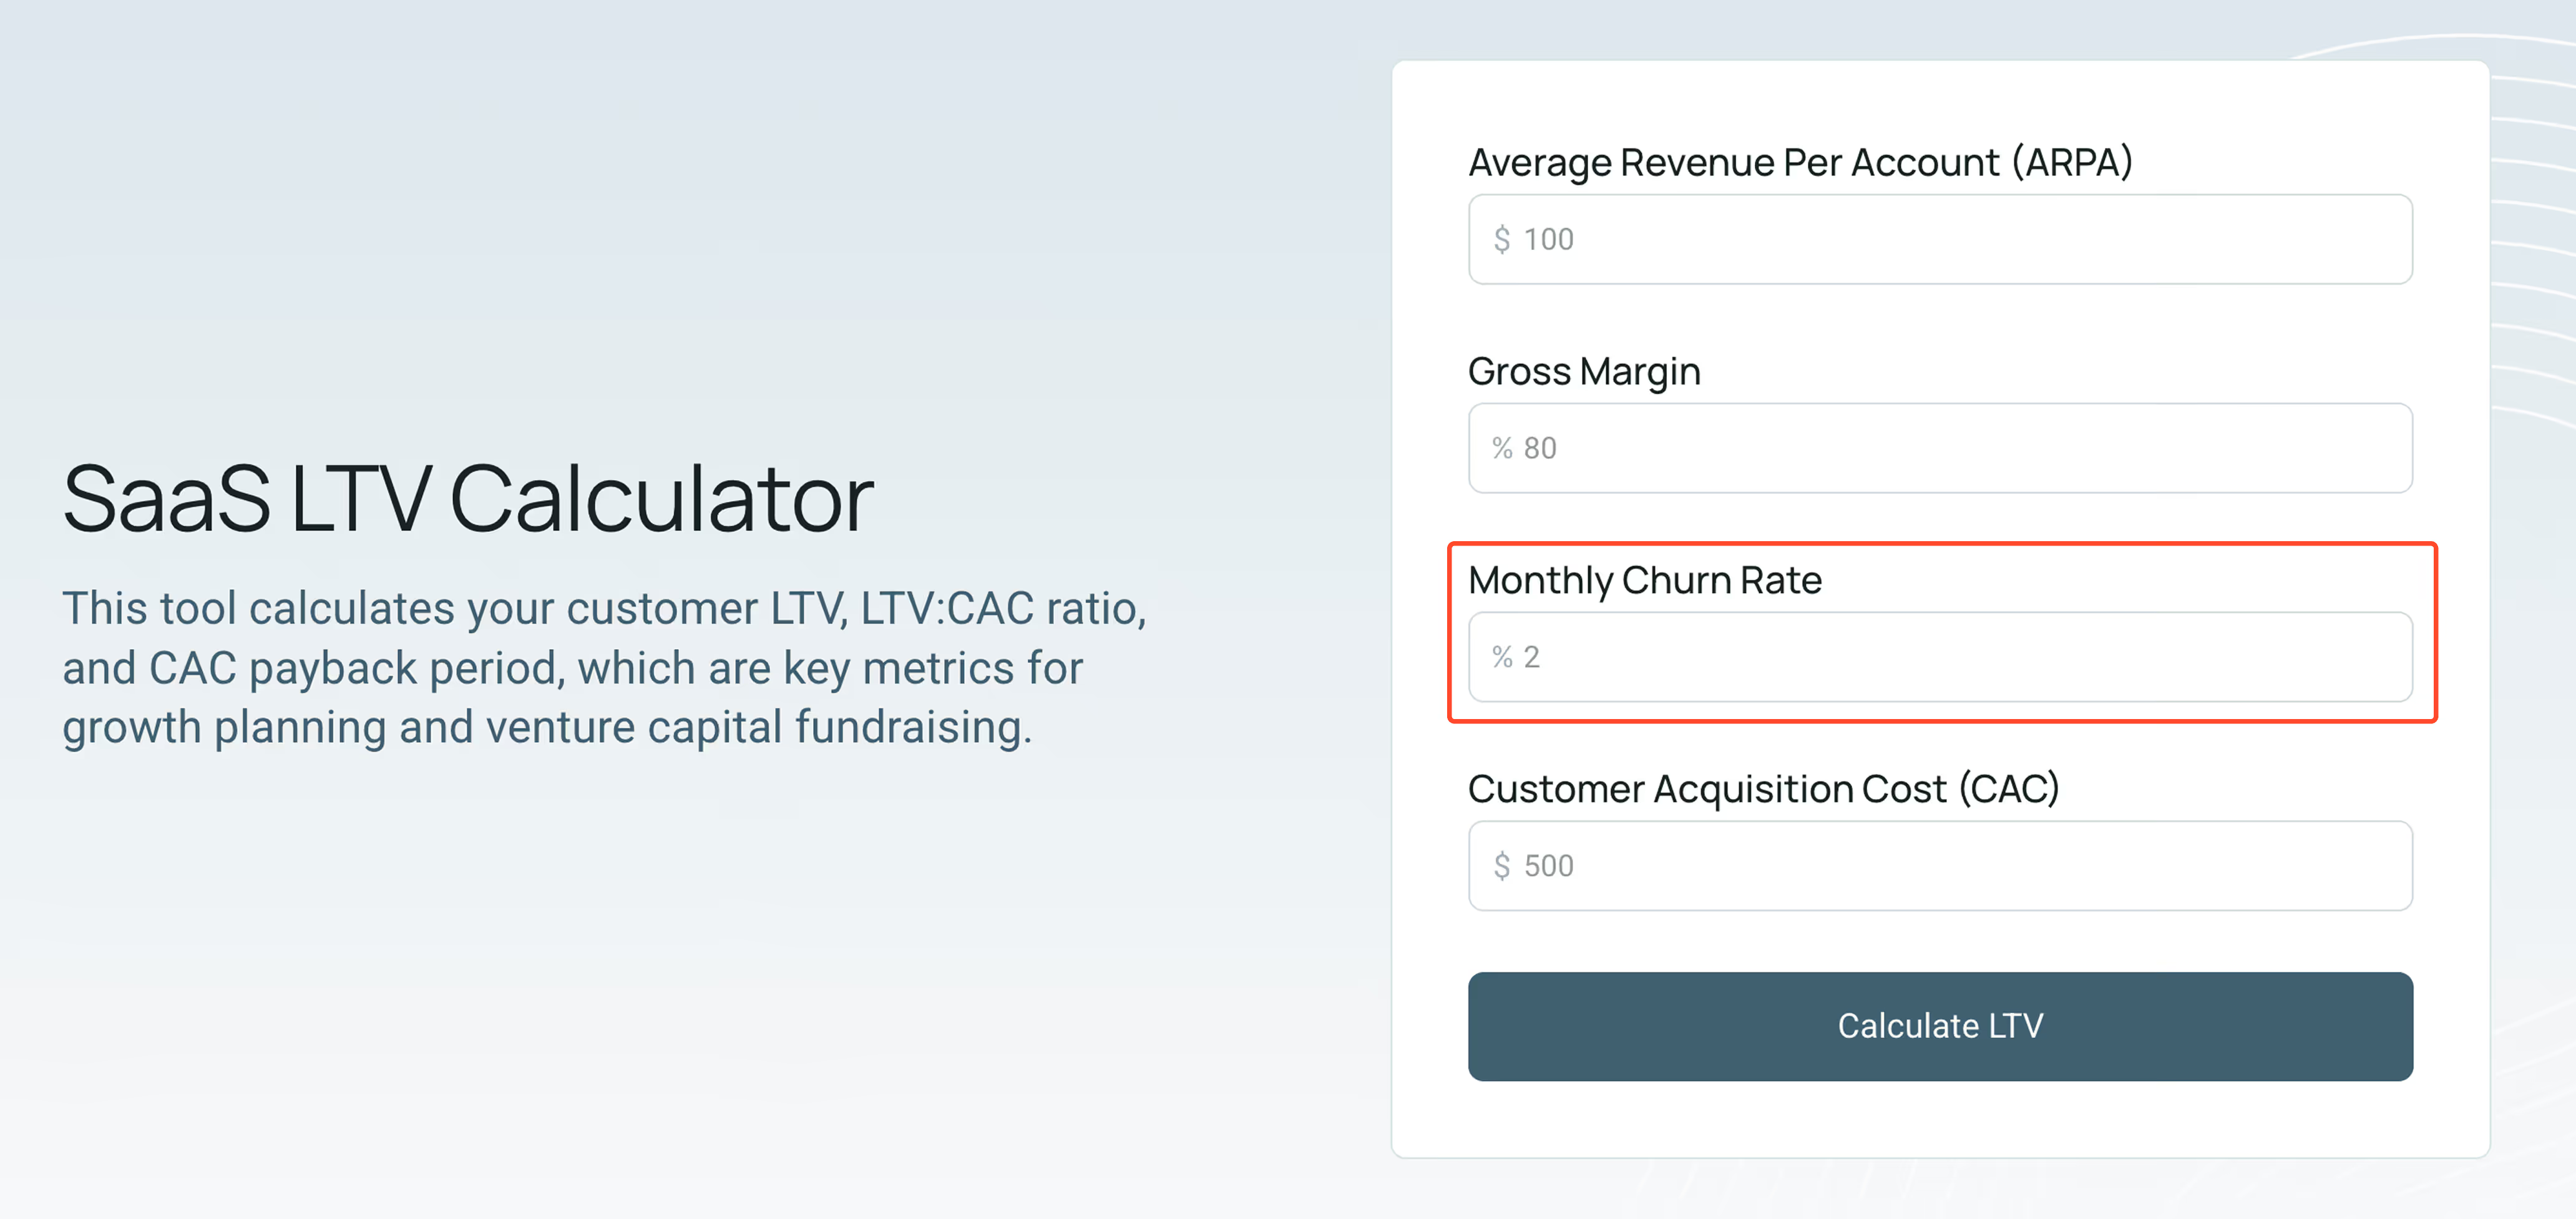
Enter your monthly churn rate as a percentage in the “Monthly churn rate” field. This represents the portion of your customer base that cancels or fails to renew their subscriptions to your software each month.
To calculate your churn rate for a given period, divide the number of customers you lost during that window by the number of customers you had at its start, then multiply the result by 100 to convert it to a percentage.
For example, say you had 500 customers on January 1st, 2026. Over the rest of the month, you gained 50 customers, but you also lost 10. In that case, you’d divide 10 by 500 to get a monthly customer churn rate of 2%.
Note that you should use the gross number of customers lost, not the net change in your outstanding customer base.
Churn informs the LTV calculation by factoring in the length of your typical relationship with a customer. The higher your monthly churn rate, the shorter your average customer lifespan, which directly reduces LTV.
Step 4: Provide your customer acquisition cost
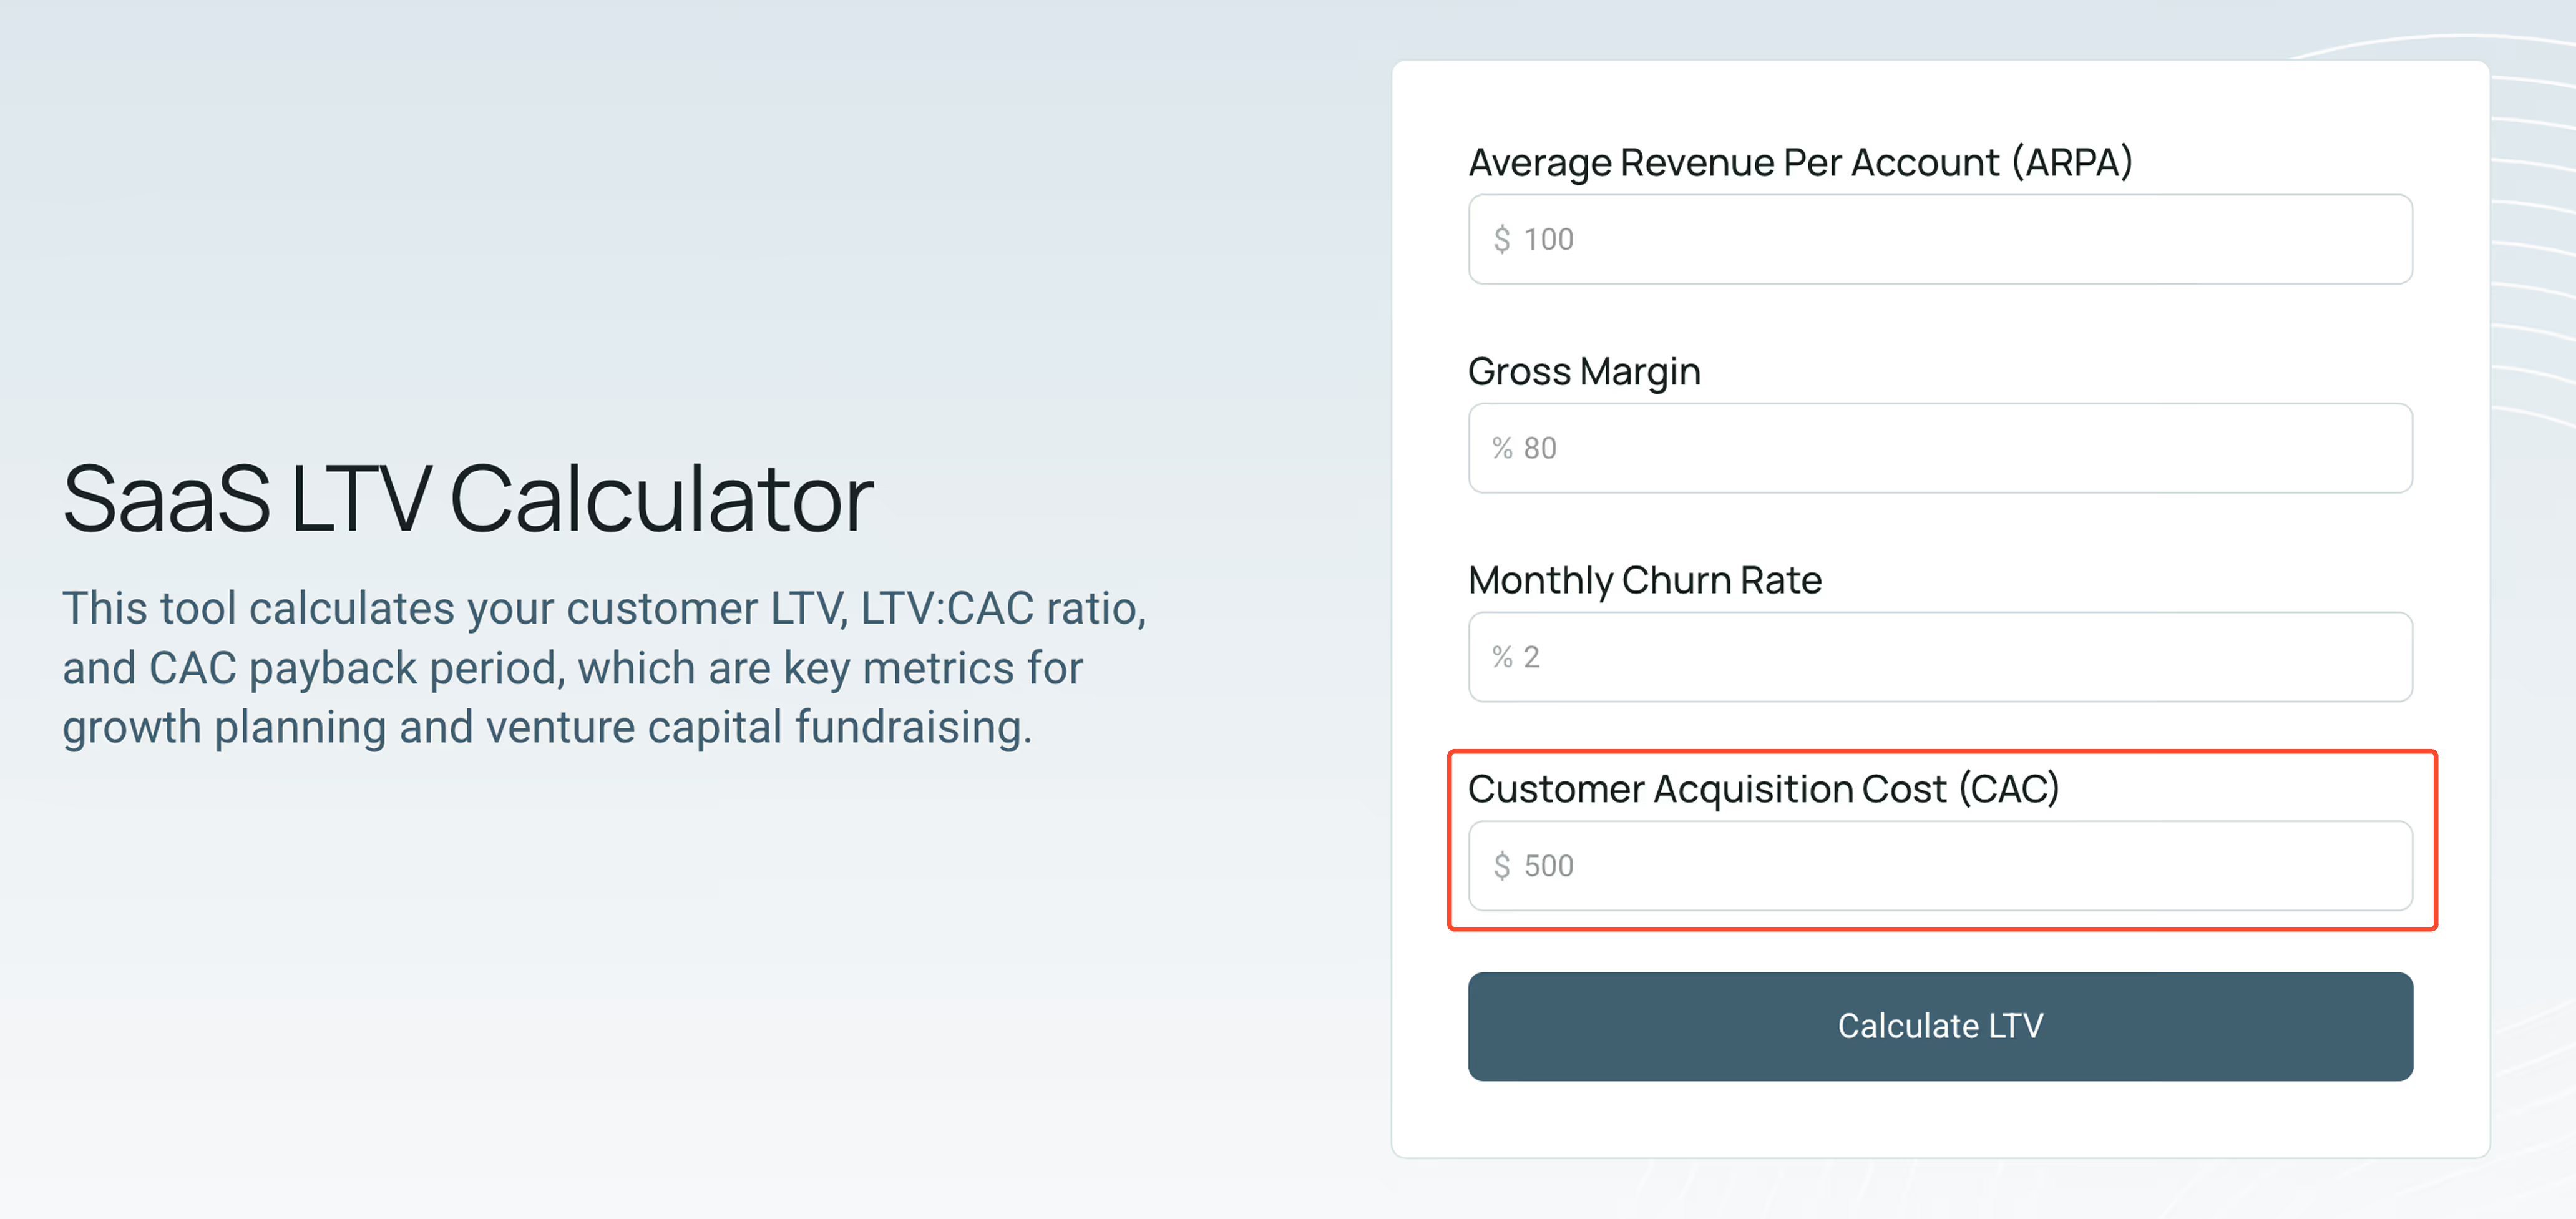
The last data point you must provide is your customer acquisition cost (CAC), which represents the average amount your business spends to acquire each new customer.
To calculate CAC, divide your total sales and marketing expenses over a given period—such as advertising costs and sales team compensation—by the number of new customers you acquired during that time.
CAC is essential for putting your LTV into context. A high lifetime value may appear attractive on its own, but if it costs nearly as much to acquire each customer, your unit economics may not be efficient.
Step 5: Click “Calculate LTV”
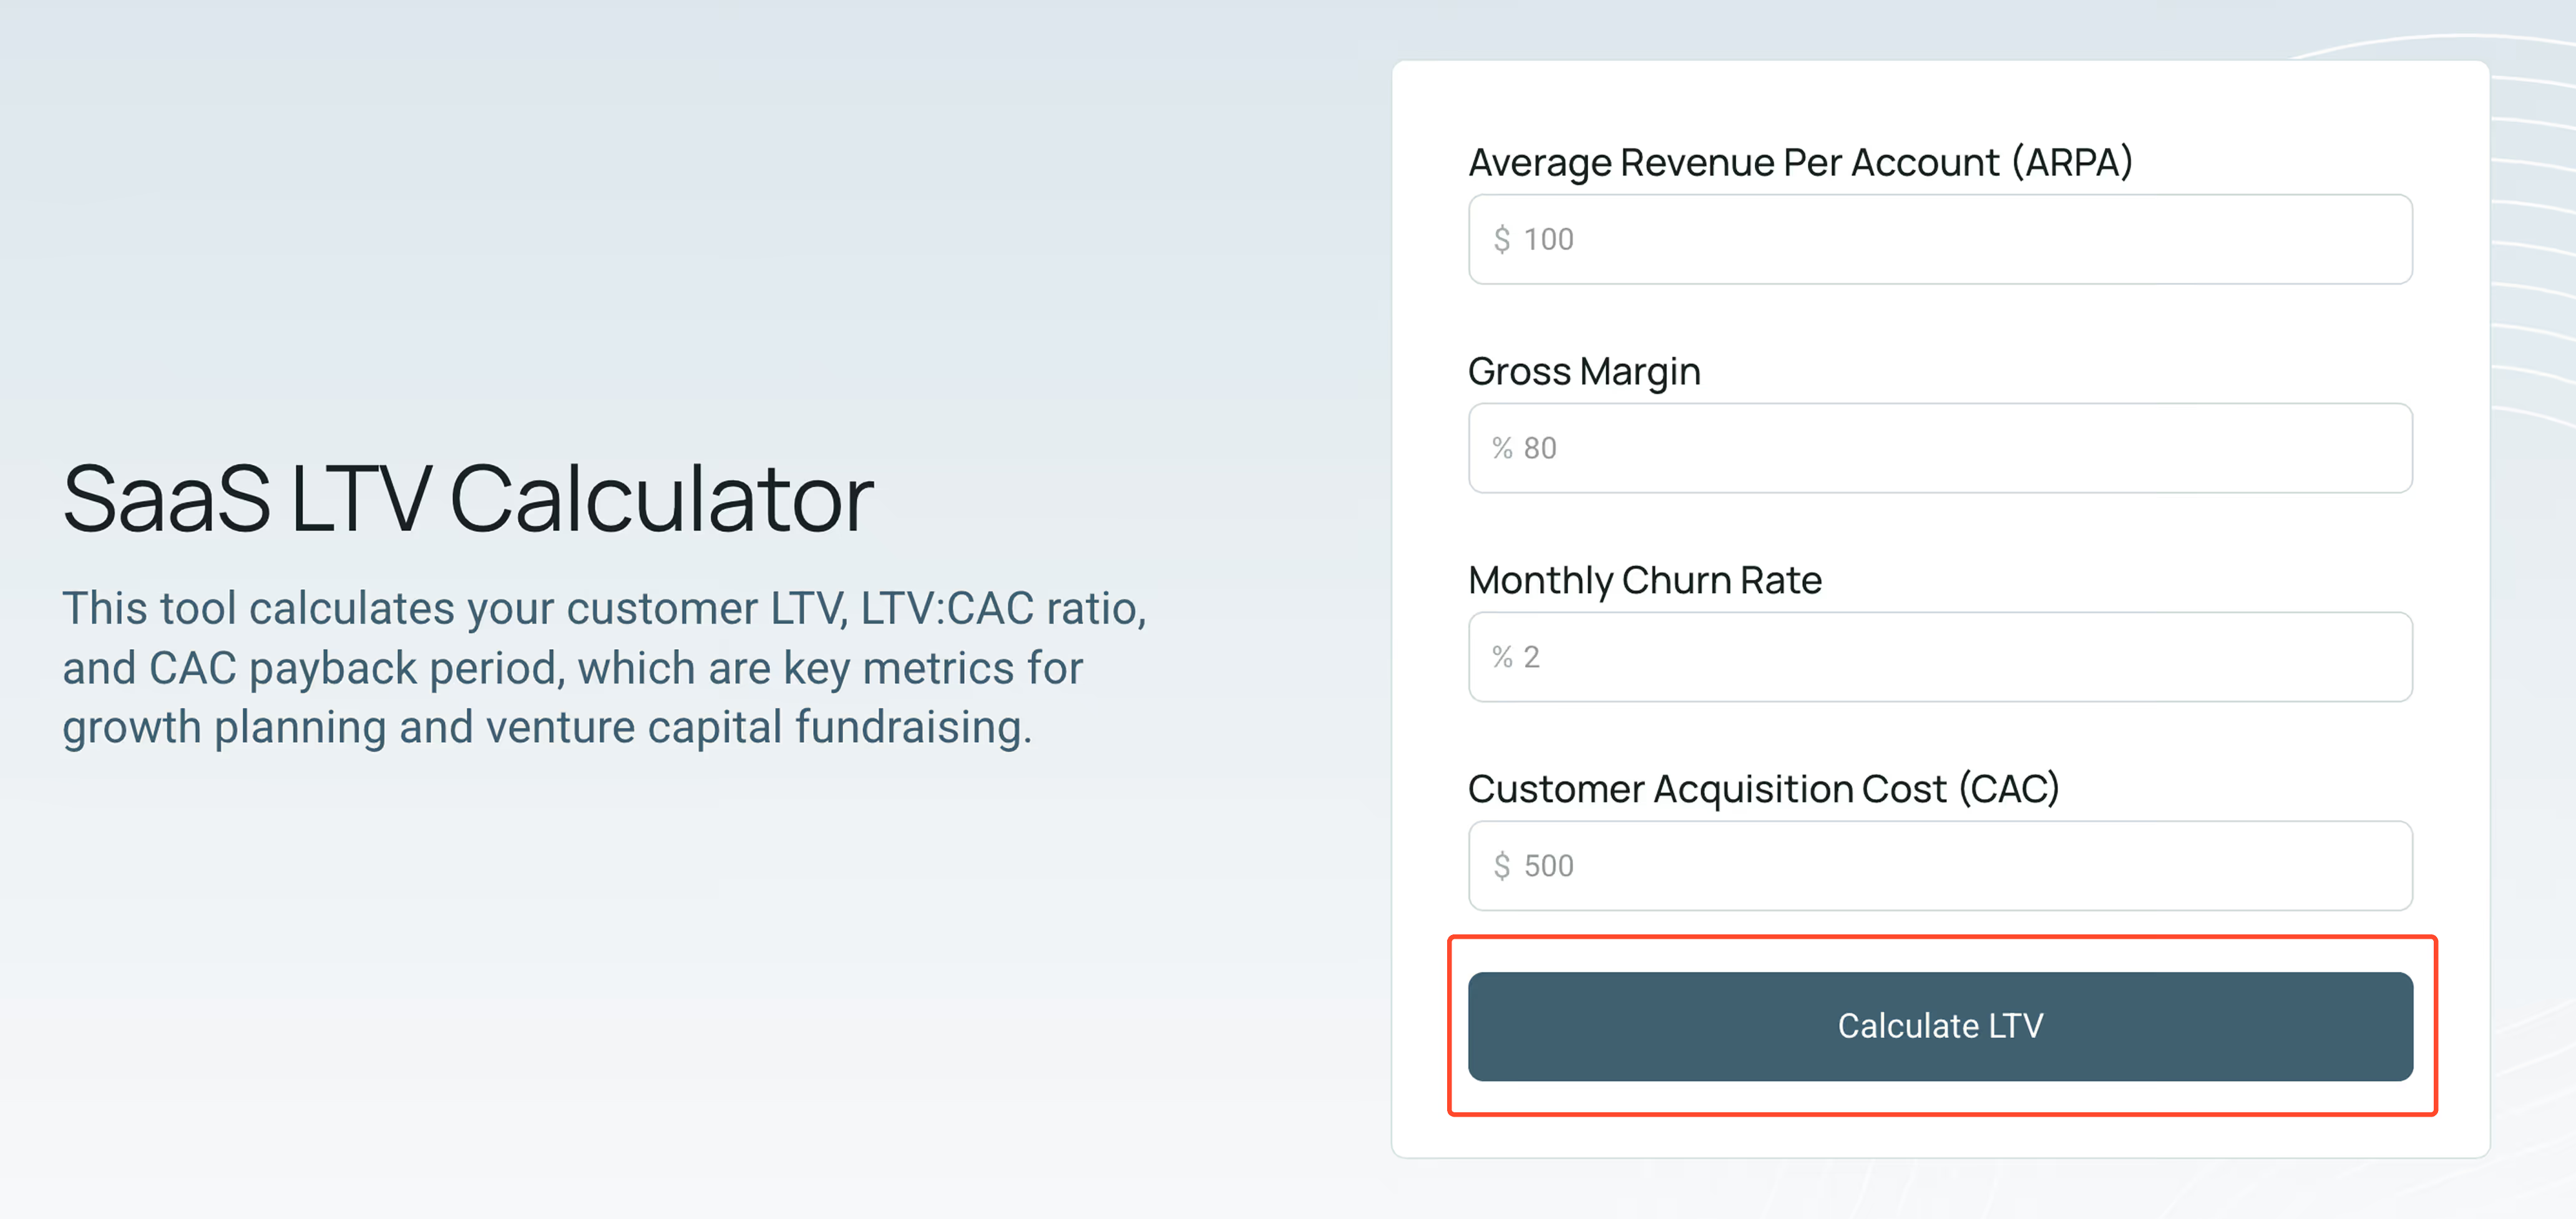
With all four fields completed, click the “Calculate LTV” button to generate your results. The calculator will automatically use your ARPA, gross profit margin, churn rate, and CAC to compute your LTV and other KPIs related to unit economics.
Step 6: Review your results
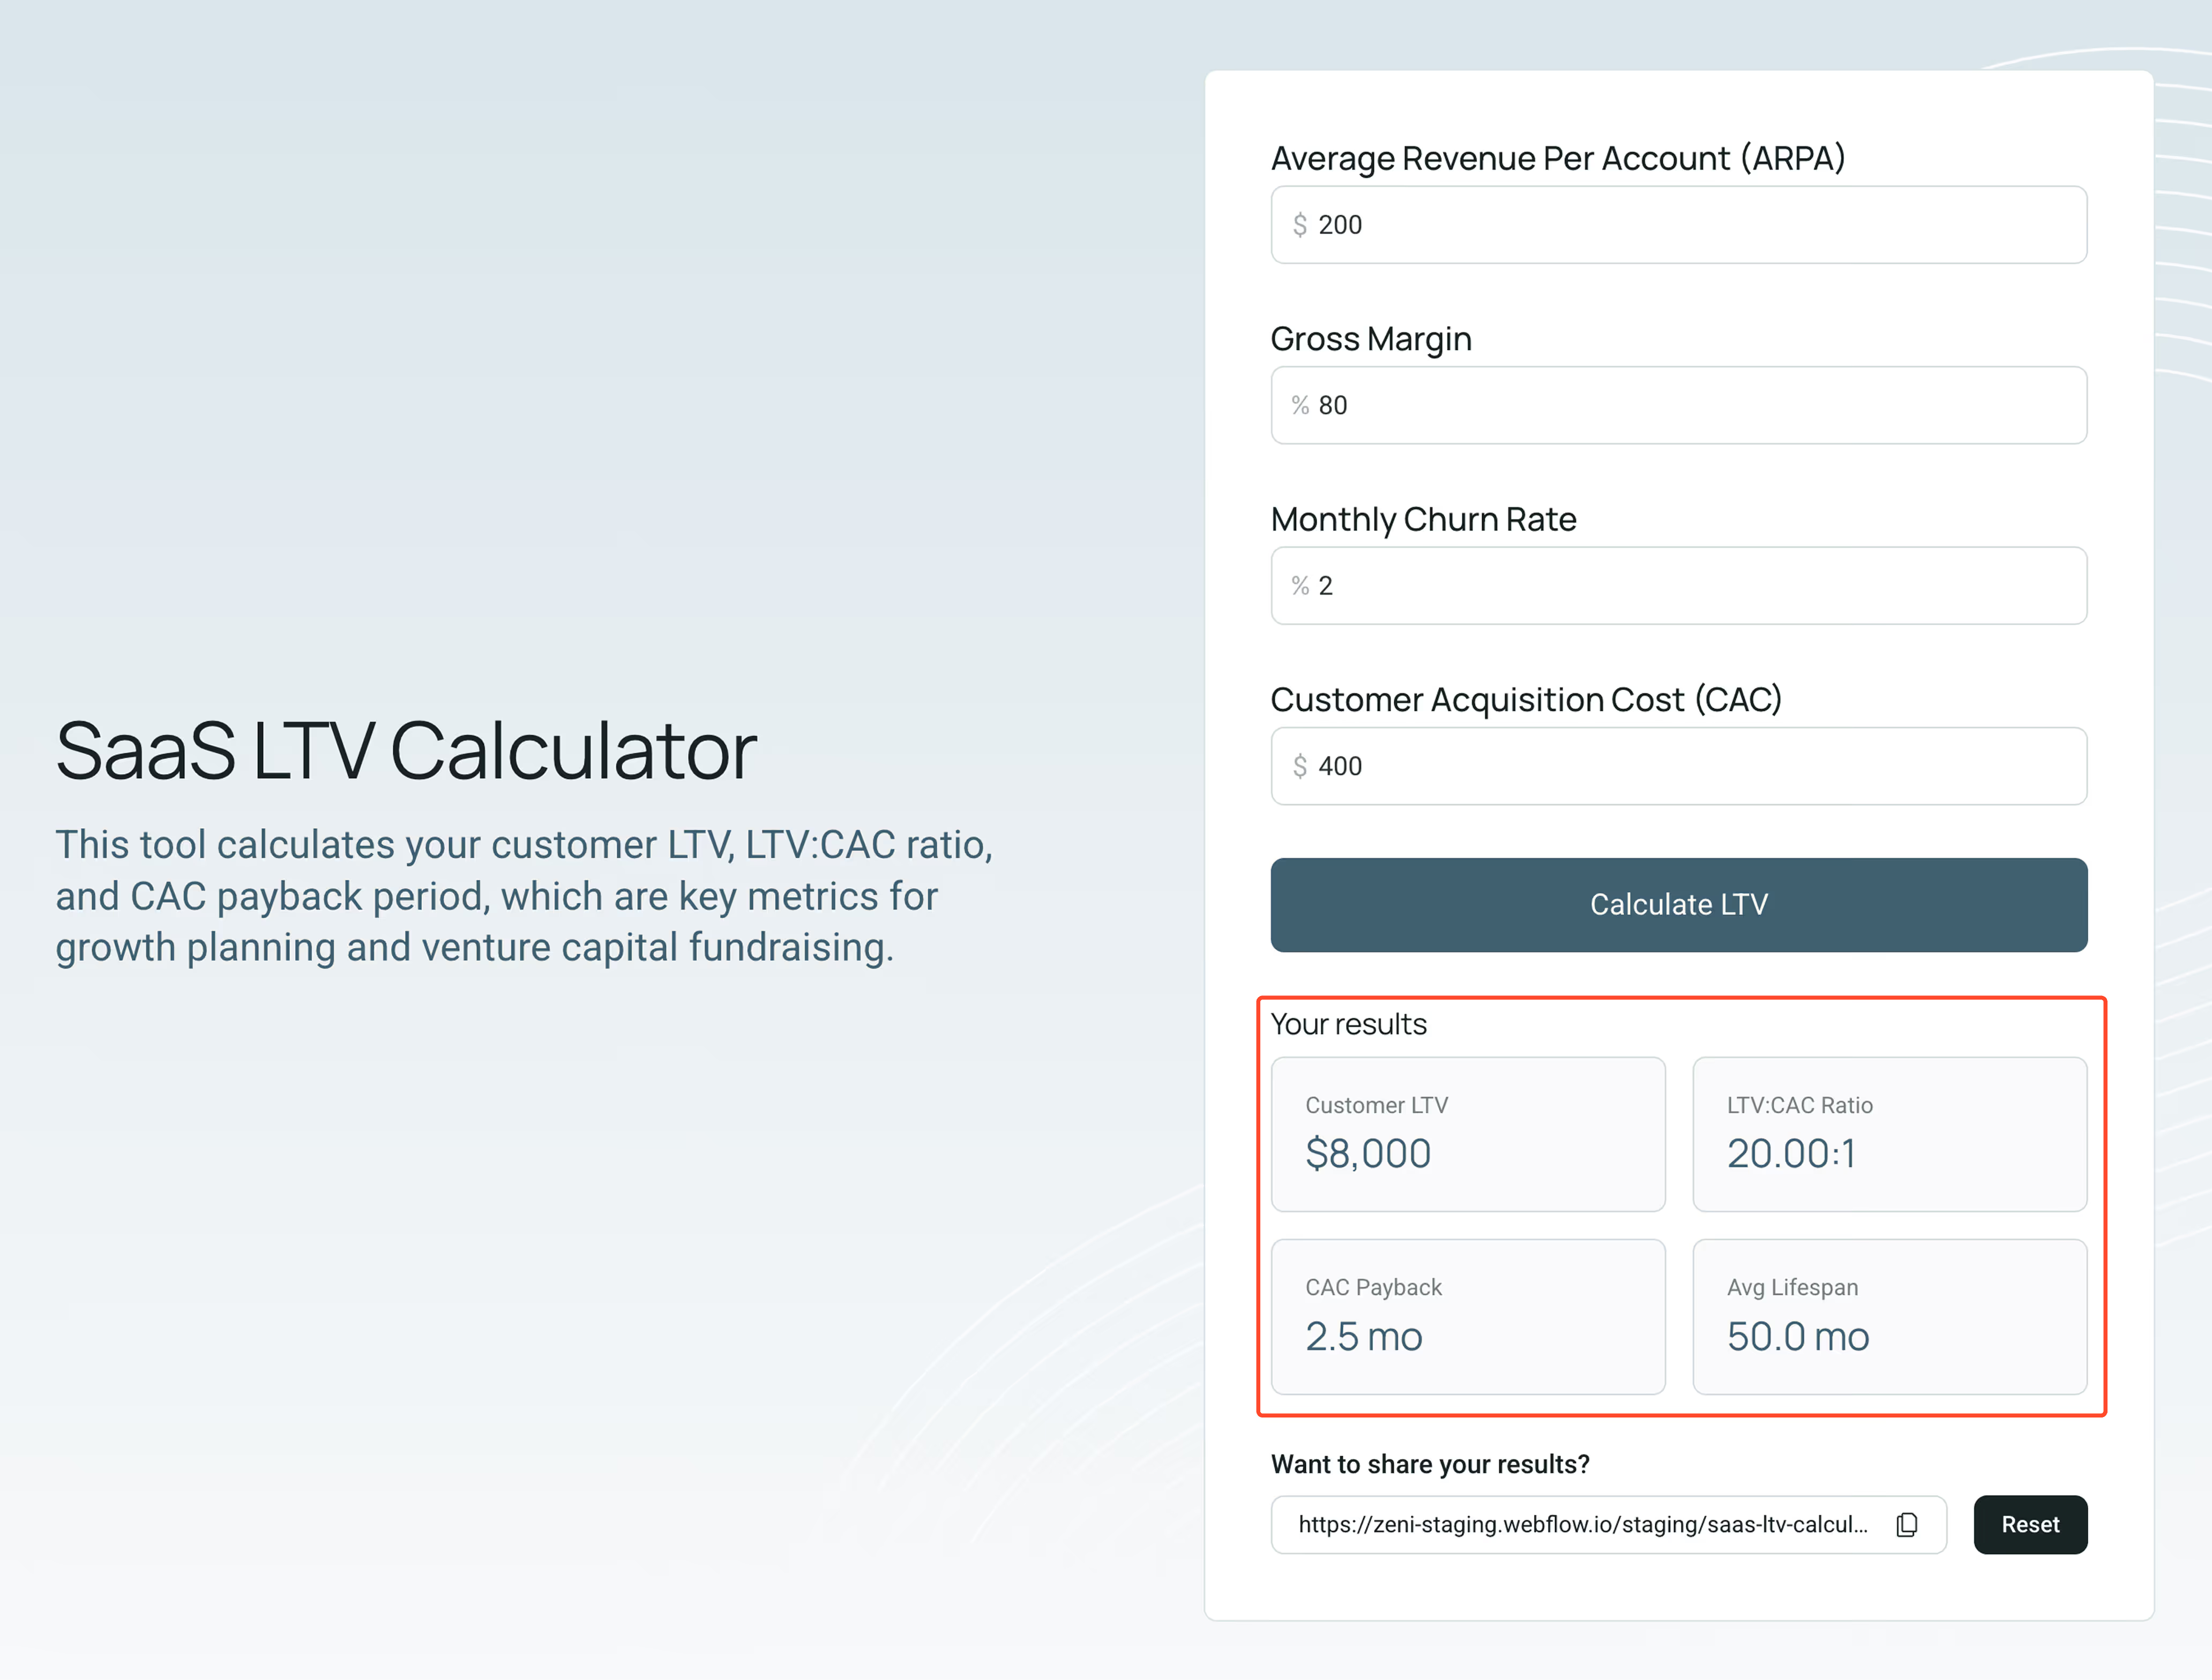
With your results in hand, review your customer LTV alongside your LTV:CAC ratio, CAC payback period, and average customer lifespan. Each metric provides a different perspective on your unit economics.
LTV reflects the total value you generate per customer, while the LTV:CAC ratio shows how efficiently you acquire that value. Your payback period highlights how quickly you recover acquisition costs, and customer lifespan reveals the strength of your retention.
Each of these metrics provides important context for the others, so make sure you consider how they interact rather than focusing on a single number in isolation.
Step 7: Adjust your inputs and recalculate
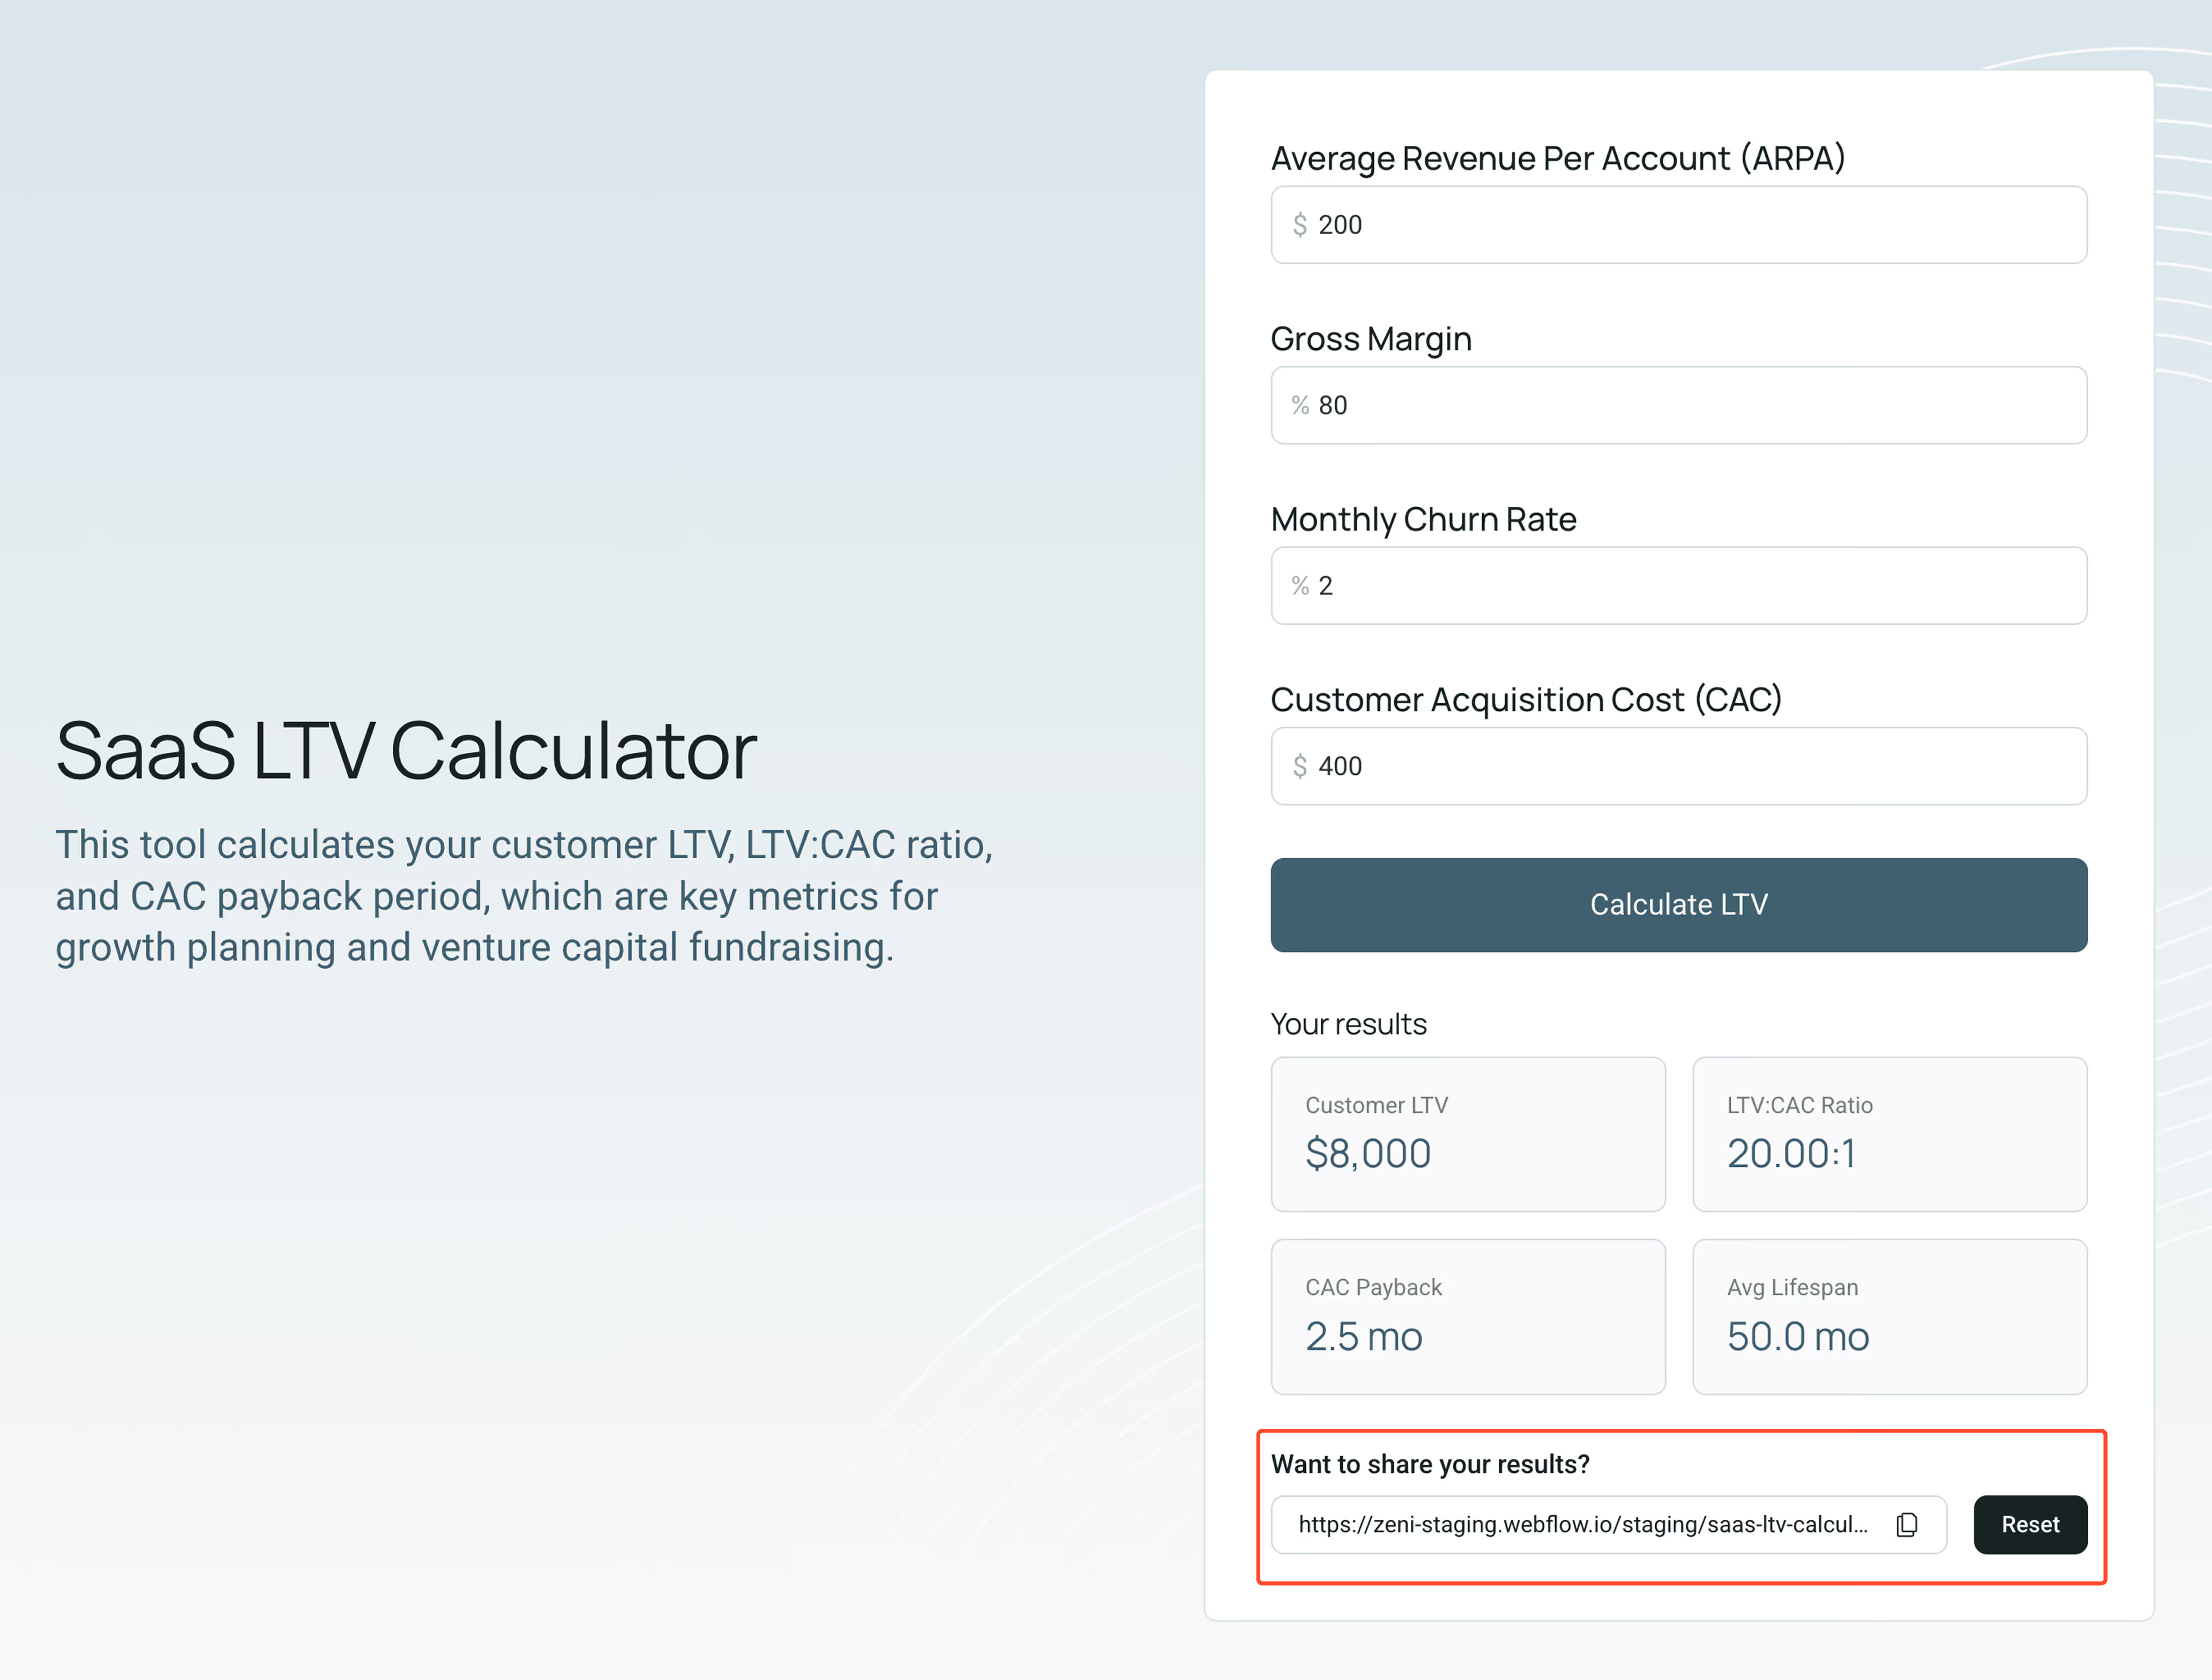
After reviewing your initial results, consider updating your inputs to see how various adjustments impact your unit economics. This can help you determine where it might be most beneficial to allocate your growth efforts.
For example, you might increase ARPA to reflect pricing changes or expansion revenue, then evaluate how much they’d contribute to a higher LTV. Alternatively, you could reduce your churn rate to gauge the impact of investing in customer retention.